The visual optimization engine in Pyramid is a heuristic that automatically redacts certain parts of a graphical visualization based on the amount of space provided. It is used to "de-clutter" the diagram when there is "too much going on".
Visual Optimization Triggers
The optimizations are initiated once the canvas space for the visual falls below 300 pixels in width, and 250 pixels in height. Below this the following items are redacted in layered stages:
- axes (both x and y)
- data labels
- legends
- grid lines
Below 150 pixels, trellis axis details are also redacted.
Visual Miniaturization
Once a visual is shrunk to less than 100 pixels, the visual "miniaturization" effect is applied. This effect does not redact the visual, but swaps it out completely for a "mini" KPI visual showing the totals for any measure used in the report. This is most often seen when using grids on mobile devices,
Turning Optimization and Miniaturization Off
Both optimization effects can be disabled or enabled.
Optimization
- Discover: choose the enable or disable optimization from the visual tab in the ribbon
- Present and Publish: right click on the item to inherit (from Discover), enable or disable optimization
Miniaturization
This setting is only applicable to Present and Publish - and can be enabled or disabled from the right click context menu per item.
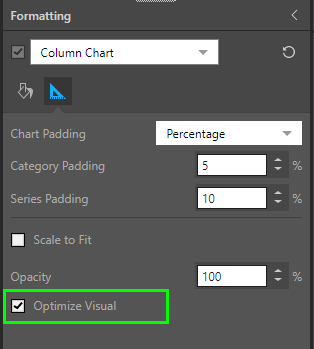
Set Optimization
Optimization is set from the Formatting panel (green highlight below). It is enabled by default, and can be disabled if needed: